UV-VIS Spectrometry for Protein Concentration Analysis: Principles and Applications
Analytics, Biologics, Proteins
- UV-VIS spectrometry is a widely used analytical technique for determining protein concentration with diverse applications in pharmaceutical industry and academic research.
- Advantages of UV-VIS spectrometry include short turnaround time, high cost-effectiveness and lack of adverse impact on the analyzed sample, which allows for its further characterization with other methods. For these and other reasons, UV-VIS spectrometry is recognized as a method of choice for protein quantitation.
- In-depth understanding of the principles and limitations of this technique as well as potential for using complementary orthogonal methods ensures obtaining accurate and reliable results.
Principles of UV-VIS spectrometry
UV-VIS spectrometry is based on the interaction of ultraviolet (UV) and visible (VIS) light with molecules, including proteins. This technique allows for the measurement of light absorption at specific wavelengths, enabling the determination of the concentration of the analyzed compound.1
Proteins primarily absorb UV light at a wavelength of 280 nm due to the presence of aromatic amino acids such as tryptophan, tyrosine, and phenylalanine. These residues act as chromophores, enabling the use of UV-VIS spectrometry for protein detection. This phenomenon can be described using the Beer-Lambert Law, which states that the absorbance of light at a specific wavelength is proportional to the concentration of the substance in the solution.2 The equation is given as follows:
A = ε ∙ c ∙ l
where A represents absorbance, ε is the molar extinction coefficient, c denotes the concentration of the substance, and l is the path length of the cuvette.
In addition to aromatic amino acids, some proteins contain other chromophores, such as heme groups or flavins, which absorb light at characteristic wavelengths. The presence of these additional structures can provide interesting insights into the structure and function of proteins.3
Instruments and equipment for protein quantitation
Accurate protein quantification using UV-VIS spectrophotometry requires specialized instruments and equipment. The UV-VIS spectrophotometer is the core instrument, measuring light absorbance at specific wavelengths. Modern models often include extra features such as multi-wavelength scanning, temperature control, and integrated software. These advancements improve both precision and efficiency of the method.
Cuvettes are used to hold the protein samples during measurements. Quartz cuvettes are ideal for UV measurements due to their high transparency, while plastic cuvettes are more suitable for visible light analysis. The choice of cuvette depends on the wavelength range and the type of sample being analyzed. The light source typically consists of a deuterium lamp for the UV range and a tungsten lamp for the visible range. This combination ensures broad wavelength coverage, making the instrument versatile for diverse applications.
Regular maintenance and calibration of equipment are critical for consistent and accurate results. This includes spectrophotometer calibration, cuvette cleaning, and light source verification.
High-purity buffers and reagents are essential to minimize interference and improve measurement stability. Commonly used reagents include Bradford assay UV-VIS, Lowry method spectrometry, and BCA assay UV-VIS solutions, which are specifically designed for protein quantification.
Analytical software plays a crucial role in simplifying the data processing. It offers features such as automated baseline corrections, calibration curve generation and statistical analysis tools, which enhance the accuracy and efficiency of protein concentration quantification.
By carefully selecting and maintaining these instruments, researchers can achieve precise and reproducible protein quantitation using UV-VIS spectrophotometry.
Common UV-VIS spectrometry methods for biologics
Spectrophotometry plays a crucial role in various scientific disciplines, including biochemistry, molecular biology, and pharmaceutical research. Different spectrophotometric methods offer varying advantages in terms of sensitivity, sample volume requirements, and interference resistance.
The below table shows a detailed comparison of the three commonly used spectrophotometric techniques:
- Traditional cuvette-based spectrophotometry,
- NanoDrop microvolume spectrophotometry,
- SoloVPE variable path length spectrophotometry.
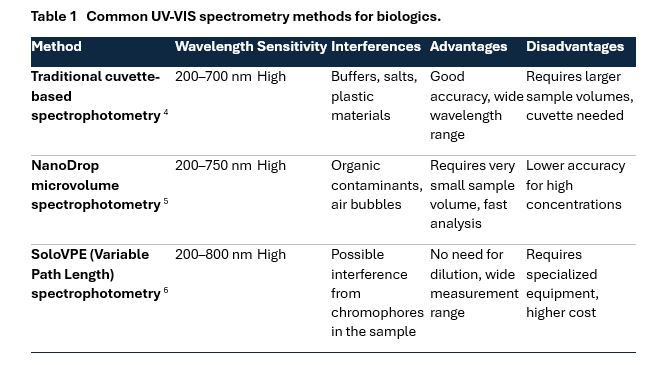
Each of these methods has its own advantages and limitations depending on the intended application. The comparison highlights key aspects such as wavelength range, sensitivity, interferences, advantages, and disadvantages to help researchers select the most suitable approach for their needs.
Each method is suited to different applications and choosing the right one requires consideration of several factors such as sample availability, required precision and potential interferences. Understanding these differences allows researchers to select the most appropriate spectrophotometric approach for their analytical needs.
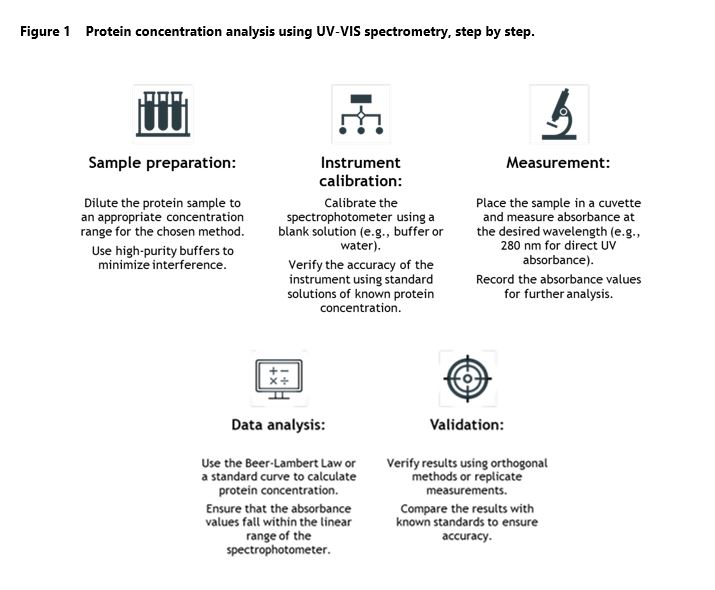
Workflow of the protein concentration analysis using UV-VIS Spectrometry
Accurate protein quantification is an integral part of many research projects and biotherapeutic development programs, and UV-VIS spectrometry is considered one of the most reliable and cost-effective approaches. The process consists of multiple steps, starting from sample preparation and ending with data analysis and validation, which together ensure precise and reproducible measurements. Figure 1 above outlines the key stages of protein concentration analysis using UV-VIS spectrometry, highlighting the best practices to obtain accurate results.
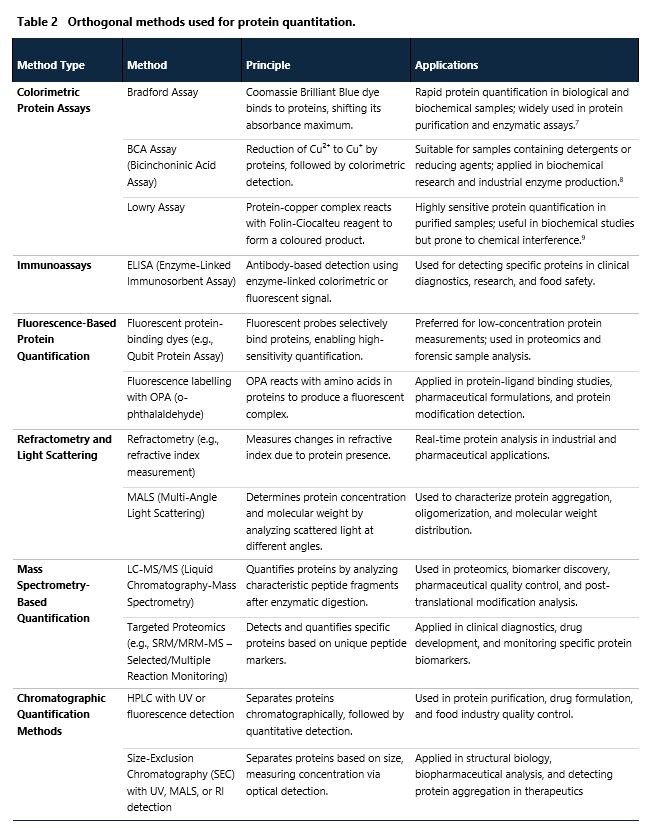
Orthogonal methods used for protein quantitation
There are many orthogonal methods that can provide accurate determination of protein concentration and are considered good alternatives to UV-VIS spectrophotometry. They can also serve as supplementary analytical tools, supporting UV-VIS in quality control, structural characterization, and validation of experimental results. These methods are employed to assess protein purity, detect posttranslational modifications, and increase accuracy in complex biological samples. Their short overview is presented in Table 2 below.
Advantages of UV-VIS spectrometry…
UV-VIS spectrometry is frequently applied to protein content analysis owing to its efficiency, versatility, and cost-effectiveness. One of its key advantages is speed and simplicity, as it allows for rapid measurements with minimal sample preparation. This makes it particularly useful for high-throughput applications where quick and reliable protein quantification is required.
Another significant benefit is that in contrast to many alternative methods UV-VIS spectrometry is non-destructive, meaning that protein samples remain intact after analysis. This is particularly convenient when further studies or experiments need to be conducted on the same sample.
In addition to being cost-effective, UV-VIS spectrometry requires relatively affordable equipment and reagents, making it an accessible technique for a wide range of laboratories, from academic research facilities to industrial settings. Its versatility allows it to be applied to various types of proteins and concentration ranges, as well as to other biomolecules such as nucleic acids.
Beyond simple quantification, UV-VIS spectrometry also enables qualitative analysis, offering insights into protein characterization, structure, interactions, and purity. This dual capability enhances its usefulness in biochemical research, pharmaceutical development, and various biotechnological applications.19,20
… and its limitations
Despite its many advantages, UV-VIS spectrometry also has certain limitations that can impact the accuracy and reliability of protein concentration measurement. One of the primary challenges is interference from contaminants, such as nucleic acids, salts, and other impurities, which are commonly encountered in biological samples. Some of these substances can absorb at similar wavelengths as proteins, leading to inaccurate measurements and requiring additional purification steps or correction methods.21
Another limitation is low sensitivity, particularly when using direct UV absorbance at 280 nm. The method may fail to detect very low protein concentrations, making it necessary to employ more sensitive techniques, such as fluorescence-based assays or colorimetric methods, which are specifically designed to handle dilute samples.22
UV-VIS spectrometry is also dependent on protein composition, as variations in amino acid content can affect absorbance readings. This is especially problematic if the analyzed protein contains a large number of aromatic residues such tryptophan and tyrosine, which can lead to inconsistencies in concentration determination, particularly when comparing different protein samples.19
Additionally, the technique has a rather limited dynamic range, meaning that very high protein concentrations may exceed the linear range of the spectrophotometer. In such cases, samples must be appropriately diluted to ensure accurate measurements, but such dilution process may itself introduce additional variability if not performed correctly.23,24
Understanding the limitations of UV-VIS spectrometry and ways of their circumventing can help researchers to expand the application of this powerful analytical tool and use it yet more efficiently.
Best UV-VIS practices in protein analysis
To achieve accurate and reproducible results in UV-VIS protein analysis, it is essential to follow the best analytical practices that minimize the risk of inadvertent errors and limit the influence of interfering factors. First, using high-purity reagents and buffers is critical to reducing interference from contaminants that can affect absorbance readings. Proper reagent selection ensures that measurements reflect protein concentration rather than unwanted background signals. Next, it is important to validate methods with standard proteins to confirm accuracy and reproducibility. Running known protein standards alongside experimental samples helps detect inconsistencies and optimize assay conditions. Additionally, selecting the appropriate sample concentration is necessary to keep absorbance readings within the linear range of the spectrophotometer. If the sample concentration is too high or too low, results may be distorted due to saturation effects or increased analytical variability. Performing replicate measurements enhances the reliability of the data by accounting for the potential experimental variations. Multiple readings allow researchers to assess precision and detect outliers that could impact the final results. Finally, integrating complementary methods alongside the UV-VIS spectrometry allows for independent validation and more comprehensive protein characterization. Techniques such as SDS-PAGE, mass spectrometry, or fluorescence-based assays can help confirm UV-VIS findings and establish protein purity and concentration.25
Bottom line
UV-VIS spectrometry is one of the most commonly used method for measuring protein concentration, providing high quality results in a short time and at relatively low cost. Moreover, unlike many alternative techniques, it is non-destructive for the analyzed samples and allows to conduct additional characterization studies on the same material. For these and other reasons, it is universally recognized as a method of choice in laboratories all over the world.
Nevertheless, several limitations of this method must be taken into account, such as interference from contaminants, low sensitivity, and potential influence of the protein composition on its accuracy. To improve reliability, researchers frequently use orthogonal methods like colorimetric assays (Bradford, BCA, Lowry), fluorescence techniques, and mass spectrometry. Understanding method’s limitations and following best practices, such as using high-purity reagents, validating with standards, and integrating orthogonal techniques, ensures accurate and reproducible results in protein analysis.
Prepared by:
Bartosz Dawid
References
- Bergethon, P. R. (2010). The Physical Basis of Biochemistry: The Foundations of Molecular Biophysics. Springer.
- Swinehart, D. F. (1962). “The Beer-Lambert Law”. Journal of Chemical Education, 39(7), 333.
- Lakowicz, J. R. (2006). Principles of Fluorescence Spectroscopy. Springer.
- Lazar, J., & Mavrodineanu, R. (2018). Standard reference materials: standard quartz cuvettes for high-accuracy spectrophotometry.. Clinical chemistry, 19 9, 1053-7 .
- Desjardins, P. (2009). Microvolume Protein Concentration Determination using the NanoDrop 2000c Spectrophotometer. Journal of Visualized Experiments : JoVE.
- Herbert, N., Das, J., & Patel, P. (2022). Validating Protein Concentration of Antibody-Drug Conjugates with the CTechTM SoloVPE® System. ADC Review / Journal of Antibody-drug Conjugates.
- Bradford, M. M. (1976). A rapid and sensitive method for the quantitation of microgram quantities of protein utilizing the principle of protein-dye binding. Analytical Biochemistry, 72(1-2), 248-254.
- Smith, P. K., et al. (1985). Measurement of protein using bicinchoninic acid. Analytical Biochemistry, 150(1), 76-85.
- Lowry, O. H., et al. (1951). Protein measurement with the Folin phenol reagent. Journal of Biological Chemistry, 193(1), 265-275.
- Engvall, E., & Perlmann, P. (1971). “Enzyme-linked immunosorbent assay (ELISA).” Journal of Immunology, 109(1), 129-135.
- Thermo Fisher Scientific. (2021). “Qubit Protein Assay Kits – User Guide.”
- Roth, M. (1971). “Fluorescence reaction for amino acids.” Analytical Chemistry, 43(7), 880-882.
- Calixto, S., Piazza, V., Gonzalez-Suarez, A., Garcia-Cordero, J., Bruce, N., Rosete-Aguilar, M., & Garnica, G. (2019). Liquid refractive index measured through a refractometer based on diffraction gratings.. Optics express, 27 24, 34705-34720.
- Matson, J., Steele, A., Mase, J., & Schulz, M. (2024). Polymer Characterization by Size-Exclusion Chromatography with Multi-Angle Light Scattering (SEC-MALS): A Tutorial Review.. Polymer chemistry, 15 3, 127-142 .
- Desouza, L., & Siu, K. (2013). Mass spectrometry-based quantification.. Clinical biochemistry, 46 6, 421-31 .
- Vidová, V., & Spáčil, Z. (2017). A review on mass spectrometry-based quantitative proteomics: Targeted and data independent acquisition.. Analytica chimica acta, 964, 7-23
- Esmaeilzadeh, S., Valizadeh, H., & Zakeri-Milani, P. (2016). A Simple, Fast, Low Cost, HPLC/UV Validated Method for Determination of Flutamide: Application to Protein Binding Studies.. Advanced pharmaceutical bulletin, 6 2, 251-6 .
- Diamante, L. (2023). High Performance Liquid Chromatography with Size Exclusion Column (HPLC-SEC) Method for Identifying the Major Whey Proteins of Whey Protein Products. Eurasian Journal of Biological and Chemical Sciences.
- Antosiewicz, J., & Shugar, D. (2016). UV–Vis spectroscopy of tyrosine side-groups in studies of protein structure. Part 2: selected applications. Biophysical Reviews, 8, 163 – 177.
- Hemmateenejad, B., Shahrivarkevishahi, A., Shakerizadeh-Shirazi, F., Rouhani, S., & Mohamadi-Gharaghani, F. (2016). A time-insensitive colorimetric sensor for the determination of total protein. RSC Advances, 6, 52026-52033
- Antony, A., & Mitra, J. (2021). Refractive index-assisted UV/Vis spectrophotometry to overcome spectral interference by impurities.. Analytica chimica acta, 1149, 238186
- Zaia, D., Verri, W., & Zaia, C. (2000). Determination Of Total Proteins In Several Tissues Of Rat: A Comparative Study Among Spectrophotometric Methods. Microchemical Journal, 64, 235-239.
- McKechnie, W., Tugcu, N., & Kandula, S. (2018). Accurate and Rapid Protein Concentration Measurement of In‐Process, High Concentration Protein Pools. Biotechnology Progress, 34.
- Kebriaei, R., & Basu, A. (2021). Microfluidic protein detection and quantification using droplet morphology. Microfluidics and Nanofluidics, 25
- METTLER TOLEDO. (n.d.). UV/VIS Spectrophotometry – Fundamentals and Applications Guide.
Related resources

Qualitative analysis of Host Cell Proteins using mass spectrometry
Analytics, Drug development, Drug product, Drug substance

Does Your CDMO Have An Analytical Edge?
Analytics, Biosimilars, Mabion

Innovative biologics – expected drug approvals in 2025
Antibody-drug conjugates, Biologics, Bispecific antibody, Clinical trials, EMA, FDA, Monoclonal antibody, Vaccines